MRI-DCE
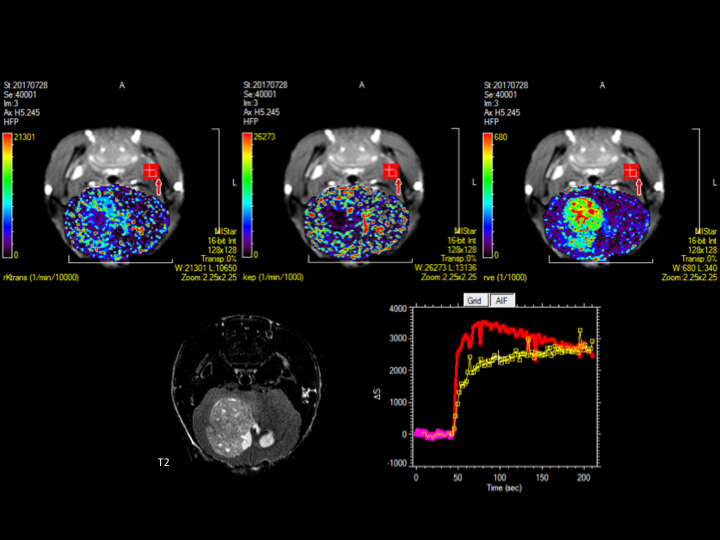
MRI-DCE of a glioblastoma syngeneic mouse model, post-contrast (Gadavist 0.5 mmol/kg). Ktrans, Kep and ve are reported with color maps in addition to the FSE-T2 anatomical image.
MRI-DCE of a glioblastoma syngeneic mouse model, post-contrast (Gadavist 0.5 mmol/kg). Ktrans, Kep and ve are reported with color maps in addition to the FSE-T2 anatomical image.